Last Update: March 10, 2018

Generally speaking, electric trucks can be operated for 20% to 35% less than horses or gas trucks and in some cases at 50% less than gas trucks on city routes. This is including everything — interest on the investment, depreciation, repairs, battery upkeep and renewals, insurance, license, etc.
The foregoing statement is based upon evidence of users of electric trucks — not upon mere claims of electric truck manufacturers. For instance, Mr. Cowie, Vice President of the American Express Company, made the statement that in their experience electric truck operating costs versus gas truck operating costs are as 17 is to 25 — gas truck costs are nearly 50% higher.
Mr. Frank Rushton, Rosedale, Kansas, in an address at the Pie Bakers’ Convention at Chicago in September, 1922, stated that his company was operating 24 electric trucks and 17 gas trucks and his cost of operating the 24 electric vehicles for the year 1921 was only $17,009.17 as against $30,267.58 for operating only 17 gas cars. His itemized figures are as follows:

| Item | 17 Gas Cars | 24 Electric Cars |
|---|---|---|
| Gasoline and oil | $6142.50 | $642.12 |
| Repairs | $7321.44 | $2418.80 |
| Tires | $4107.24 | $936.08 |
| Labor Garage | $4046.20 | $3560.20 |
| Licenses | $248.20 | $213.37 |
| Depreciation | $6600.00 | $4800.00 |
| Current | N/A | $2461.50 |
| Insurance | $1802.00 | $1950.00 |
| TOTAL | $30267.58 | $17009.07 |
From this it is evident that the average cost per year for his electric trucks is $708.71 as against $1,780.44 apiece for his gas trucks.
Mr. McClellan, General Manager of the Chalmette Laundry, New Orleans, has stated that their 47 electric trucks have saved them nearly $50,000 compared with their former delivery — wagons and mules.
It is a significant fact in this connection that the electric truck is making the greatest headway where the price of the product is small, and the margin of profit per package is slight — the baking field, the laundry field, dairy field, ice cream, etc.
A large baking company with several plants bought about a dozen electric trucks for one plant to test out whether electrics could save them money. As a result of their experience, they authorized a complete survey of their other plants — see page 332.
They are now eliminating all horses-and-wagons and are replacing a number of their gas trucks with electrics, shifting these gas trucks to longer routes.
Even in the milk field, electrics are displacing horses because electrics save both time and money. The fallacy that the horse that knows the route saves time has been exposed by stop-watch tests. The Budd Dairy Company, for instance, of Columbus, Ohio, checked the electric versus the horse knowing the route, on both short-haul and long-haul routes on house-to-house milk delivery. On the long routes the electric saved 1 1/4 hours a day and on the short trips 15 minutes a trip, enabling drivers to do approximately 20% more work. Result — Budd Dairy Company operates 18 electric trucks in house-to-house milk delivery.
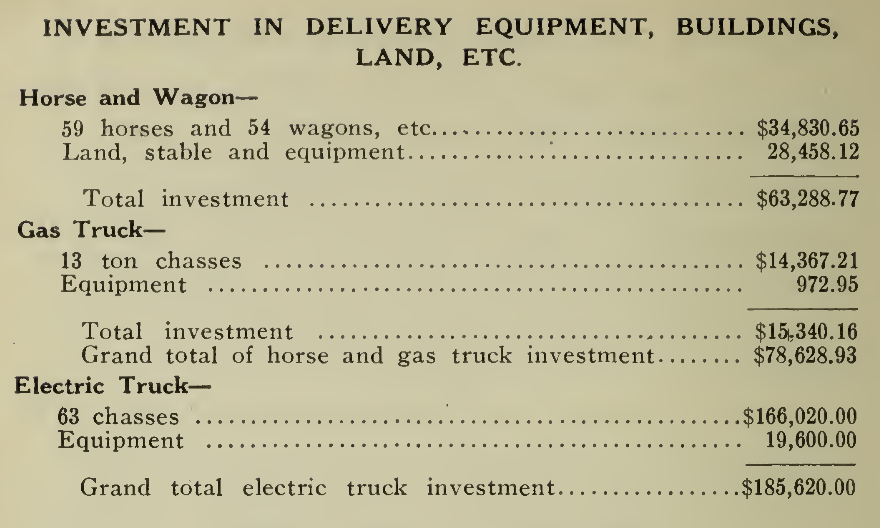
Investment in Delivery Equipment, Buildings, Land, etc.
| Horse and Wagon | Cost |
|---|---|
| 59 horses, 54 wagons, etc | $34,830.65 |
| Land, stable and equipment | $28,458.12 |
| TOTAL | $63,288.77 |
| Gas Truck | Cost |
|---|---|
| 13 ton chassis | $14,367.21 |
| Equipment | $972.95 |
| TOTAL | $15,340.16 |
| SUB-TOTAL | $78,628.93 |
| Electric Truck | Cost |
|---|---|
| 63 chassis | $166,020.00 |
| Equipment | $9,600.00 |
| TOTAL | $185,620.00 |
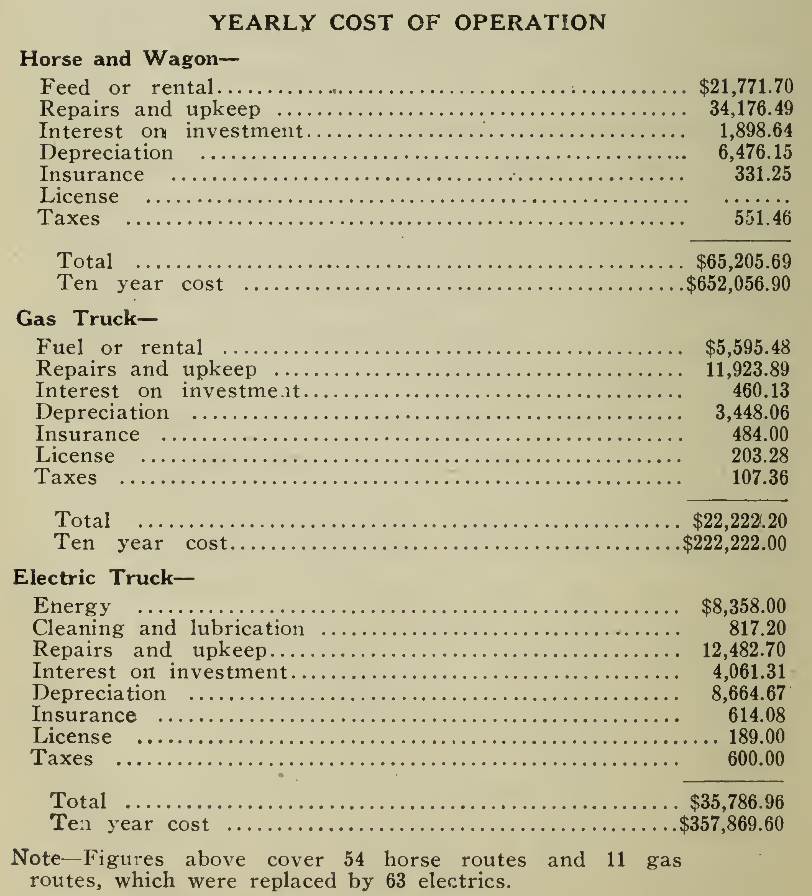
Yearly Cost of Operations
| Horse and Wagon | Cost |
|---|---|
| Feed or rental | $21,771.70 |
| Repairs and upkeep | $34,176.49 |
| Interest on investment | $1,898.64 |
| Depreciation | $6,476.15 |
| Insurance | $331.25 |
| License | -.-- |
| Taxes | $551.46 |
| TOTAL | $65,205.69 |
| TEN YEAR TOTAL | $652,056.90 |
| Gas Truck | Cost |
|---|---|
| Fuel or rental | $5,595.48 |
| Repairs and upkeep | $11,923.89 |
| Interest on investment | $460.13 |
| Depreciation | $3,448.06 |
| Insurance | $484.00 |
| License | $203.28 |
| Taxes | $107.36 |
| TOTAL | $22,222.20 |
| TEN YEAR TOTAL | $222,222.00 |
| Electric Truck | Cost |
|---|---|
| Energy | $8,358.00 |
| Cleaning and lubrication | $817.20 |
| Repairs and upkeep | $12,482.70 |
| Interest on investment | $4,061.31 |
| Depreciation | $8,664.67 |
| Insurance | $614.08 |
| License | $189.00 |
| Taxes | $600.00 |
| TOTAL | $35,786.96 |
| TEN YEAR TOTAL | $357,869.60 |
NOTE - These figures above cover 54 horse routes and 11 gas routes, which were replaced by 63 electrics.
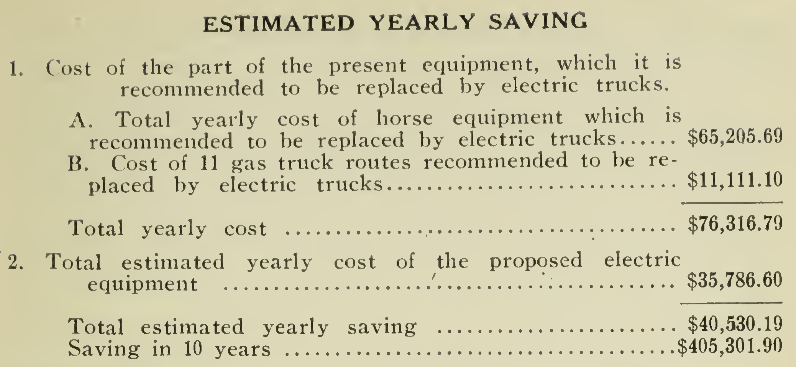
Estimated Yearly Saving
- Cost of the part of the present equipment, which it is recommended to be replaced by electric trucks A. Total yearly cost of the horse equipment which is recommended to be replaced by electric trucks .... $65,205.69 B. Cost of 11 gas truck routes recommended to be replaced by electric trucks ..... $11,111.10
- Total estimated cost of the proposed electric equipment ..... $35,768.60
- Total estimated yearly saving ........ $40,530.19
- Saving for 10 years ................... $405,301.90
One may ask “How can the electric possibly save time under such conditions?'’ To begin with, the electric gets to and from the route in less time than the horse. Secondly, even when on the actual delivery route, the electric saves time because with a horse-and-wagon the driver walks his route and the time it takes him to cover it is the time it takes him to walk it. With the electric, he drives between stops, saving considerable time over the horse in half-block, quarter-block and block runs. Incidentally, the electric starts quicker than a horse and gets away faster and. stops quicker. It never gets ahead of the driver when he needs some extra cream or extra butter or eggs as a result of a note found in the bottle. The electric never runs away, never chews up trees, shrubbery, etc.
The saving in time and money together are sufficiently great to result in an economy equivalent to between 2% and 3% of a milk dealer’s business per year. If he is averaging say 10% on his gross volume, this saving means an increase in profit of between 20% and 30%.
The following figures of an analysis on house-to-house milk delivery are based on a plant where horse costs were unusually favorable and yet the comparison shows the electric to be sufficiently economical to save a sum equivalent to more than 2 1/2% of the gross volume.

| 54 Retail Horse-Drawn routes (N) | Cost |
|---|---|
| Feed | $41,273.76 |
| Wagons, repair, painting | $14,079.73 |
| Harness | $3,268.15 |
| Interest on investment, 3% | $810.00 |
| Depreciation | $9,000.00 |
| TOTAL | $74,440.09 |
| 10 year cost of horse delivery | $744,400.90 |
| 44 Electric Truck routes (N) | Cost |
|---|---|
| Current at $0.025 per kWh | $41,273.76 |
| Cleaning and lubrication | $660.00 |
| Repairs and parts, chassis | $1,386.71 |
| Body repairs and painting | $4,752.00 |
| Battery expense | $10,807.92 |
| Tires | $2,772.00 |
| Interest on investment, vehicles, 3% | $2,545.30 |
| Interest on investment, equipment, 3% | $390.00 |
| Depreciation, vehicles, 10% | $8,484.35 |
| Depreciation, equipment, 5% | $650.00 |
| Insurance | $1,138.59 |
| License | $176.00 |
| Garage help | $7,200.00 |
| TOTAL | $50,817.75 |
| 10 year cost of horse delivery | $508,177.50 |
N - Greater load capacity of electrics, greater speed and consequent saving in time, enables 44 electrics to do the work of 54 horse teams
Horse depreciation at 20 percent, stable at 5 percent, wagons at 10 percent, harness at 20 percent, and equipment at 10 percent. Average life of a horse is figured at 5 years, although in New York and other large cities the average is 4 years.
In view of the economy of the electric over the horse and the gas truck, why is it that it is not universally used on short-haul city routes?
The answer is — ignorance. Business men do not know their delivery costs. Any business man who will get together his complete delivery costs will be astounded at the total cost of horses and wagons and gas trucks on city routes. In the dairy business, for instance, delivery is costing from 20c to 25c out of every dollar the dairyman takes in and sometimes more — including interest, depreciation, and maintenance on vehicles, stable buildings, etc., operating costs, insurance, drivers’ salaries, and commissions, etc. Is it any wonder that efficiency in delivery, effected through the use of electric trucks, can save a sum equivalent to 2% or of a gross business per year, thereby increasing profits by 20% to 30%!
In the ice cream field, delivery is costing between 20% and 25% — and sometimes 30%, depending somewhat on how the ice and salt are figured.
In the bakery field, delivery is ranging from 18c to 25c out of every dollar.
Laundry delivery is costing from 20c to 30c out of each dollar the laundry owner takes in.
In the department store field, where delivery is a much smaller per cent, of gross sales, due to the greater value of the parcels and the fact that numerous parcels are carried home or sent by parcel post, even in this field delivery amounts to a staggering sum in dollars and cents.
When it is considered that the Harvard Survey shows that department store profits are a very small percentage of gross sales — ranging from about 3/4 of 1% up to about 3% — and when it is considered that delivery in the department store field ranges anywhere from ^ of 1% up to 3% or 4% — it will readily be seen that inefficient or extravagant delivery can wipe out a department store’s profits.
In view of such figures as these, is it not astounding that the average business man does not know his delivery costs?
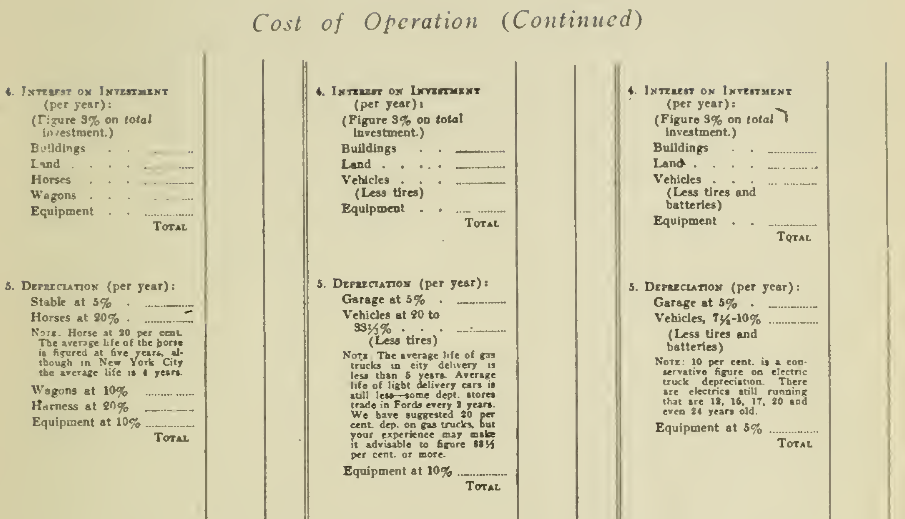
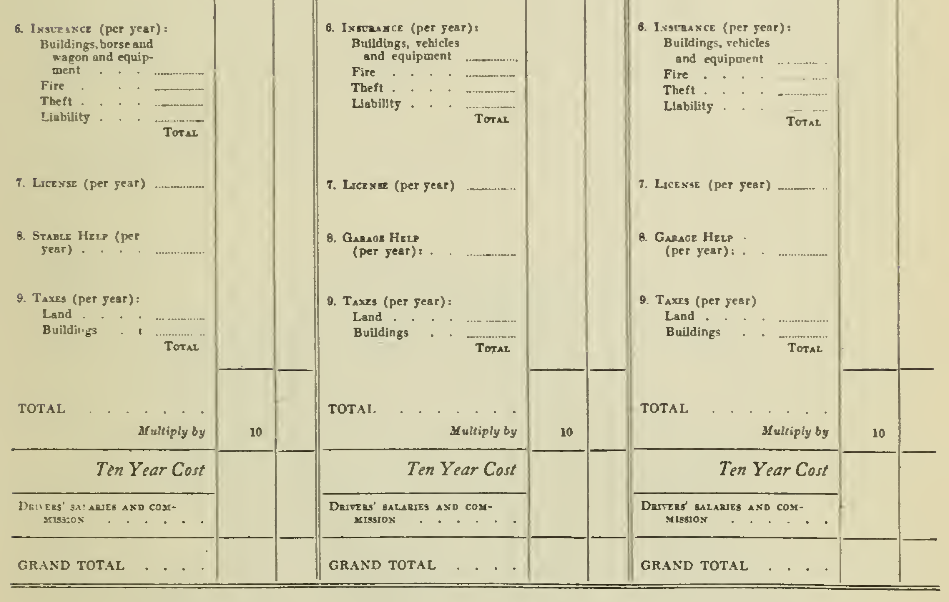
It is particularly astounding when there is such a simple way of getting at the facts. Even if a concern hasn’t kept its figures on delivery properly, it is comparatively easy to get to the bottom of the subject. On pages 368 and 369 is shown a Cost Analysis Form arranged in three columns, one for horses, one for gas trucks, and one for electric trucks. No matter how a concern has kept its books — whether it separates its delivery or not — the invoices, checks and cash vouchers are in the bookkeeping system and the bookkeeper can usually get the figures together in a very short time by following this Cost Analysis Form.
When these figures are assembled on horse delivery and gas trucks on city routes, the total will be a genuine surprise to the business man who has been wondering why his overhead is so high. When the yearly cost is multiplied in each case by 10 or 15 years — a period long enough to take into full consideration the life of the electric truck versus the much shorter life of horses and gas trucks on frequent-stop routes, the possible saving through the use of electric trucks will pile up until it looks like a mountain.
If every business man in this country would have his delivery costs assembled on a form similar to this and then set up against his horse or gas truck costs the much lower cost of electric trucks, it would bring about a revolution in delivery equipment.
Instead of looking- at his horse costs as a question of the horse itself, the wagon, feed and shoeing and a few other incidentals, as he now does, he would have complete figures — 40 odd items that enter into, horse delivery costs.
Instead of depreciating or charging off horses, vehicles, stables, garages, etc., through a general depreciation fund, by charging them off separately, each according to its proper life, he will get a new viewpoint, because horses and gas trucks average only 5 years on frequent-stop routes — the cheap light gas trucks are trade in every 2 or 3 years — whereas electric trucks, built to last more than 10 years, can be safely depreciated at 10% a year as against 20% on horses and 20% to 33 1/3% on gas trucks.
Another cost item that is worth any business man's attention is that of stable lands and buildings. The horse requires two to three times the space of an electric truck when you take into consideration the space required by the wagon, the stall for the horse and the horse's share of the hay loft, feed room, harness room, etc. Leading bakers and others have done away with the stable or garage building entirely, storing and charging electric trucks right at the loading platform.
Another economy that must be considered is the higher efficiency of electric trucks in days in service per year. Gas trucks are out of service from 30 to 40 days a year including repairs, replacements, tire changes, revarnishing, etc. It is unusual for an electric truck to be out of service half this long even including revarnishing.


Fleet performance records on electrics average higher than 98% days in service.
This higher efficiency of the electric enables a business man to operate his delivery with fewer spare vehicles than he requires if he uses either gas trucks or horses — because we all know that the horse must have his rest periods, that he is in very bad shape after severe snows, and that he is at times indisposed and unable to work.
Most businesses are doing a good volume today in spite of lower prices for products and services. But profits are not so good — overhead is still too high.
It is already clearly evident that wages cannot be brought down rapidly. The economies must be effected somewhere else — overhead must be cut in some other way. Delivery, often the biggest overhead item, offers the opportunity to reduce overhead and thereby increase profits.
So long as a business man looks only at first cost of the different types of delivery equipment, he will never buy electric trucks because they cost more to build and therefore are high-priced. But if he gets the complete story — first cost divided by the years of life, and the much lower operating costs on electric trucks, it will be immediately clear that the economies of the electric are so great that they wipe out the difference in first cost in a jiffy, and from then on pay profits. In fact, the statement has been made and proved that in many instances if a business had got its stable of horses or its original gas trucks for nothing, it could not afford to operate them compared with electric trucks at their high first cost.
The business man who continues to operate horses or gas trucks because of the smaller investment is burdening his business with a heavy millstone and may even be placing his business in the position where delivery may make the difference between a profitable and an unprofitable business.
In the keen competition of today and with the public continually demanding lower prices, it is almost fatal to neglect this important subject of delivery. A business man may have an honest difference of opinion at the start. He may conscientiously believe that horses and gas trucks are cheaper for him on city routes. But why guess? Why not get the facts Why not set up his horse figures and gas truck figures in the way suggested here and then set up opposite them electric truck- figures, including everything. The totals will speak for themselves!
